
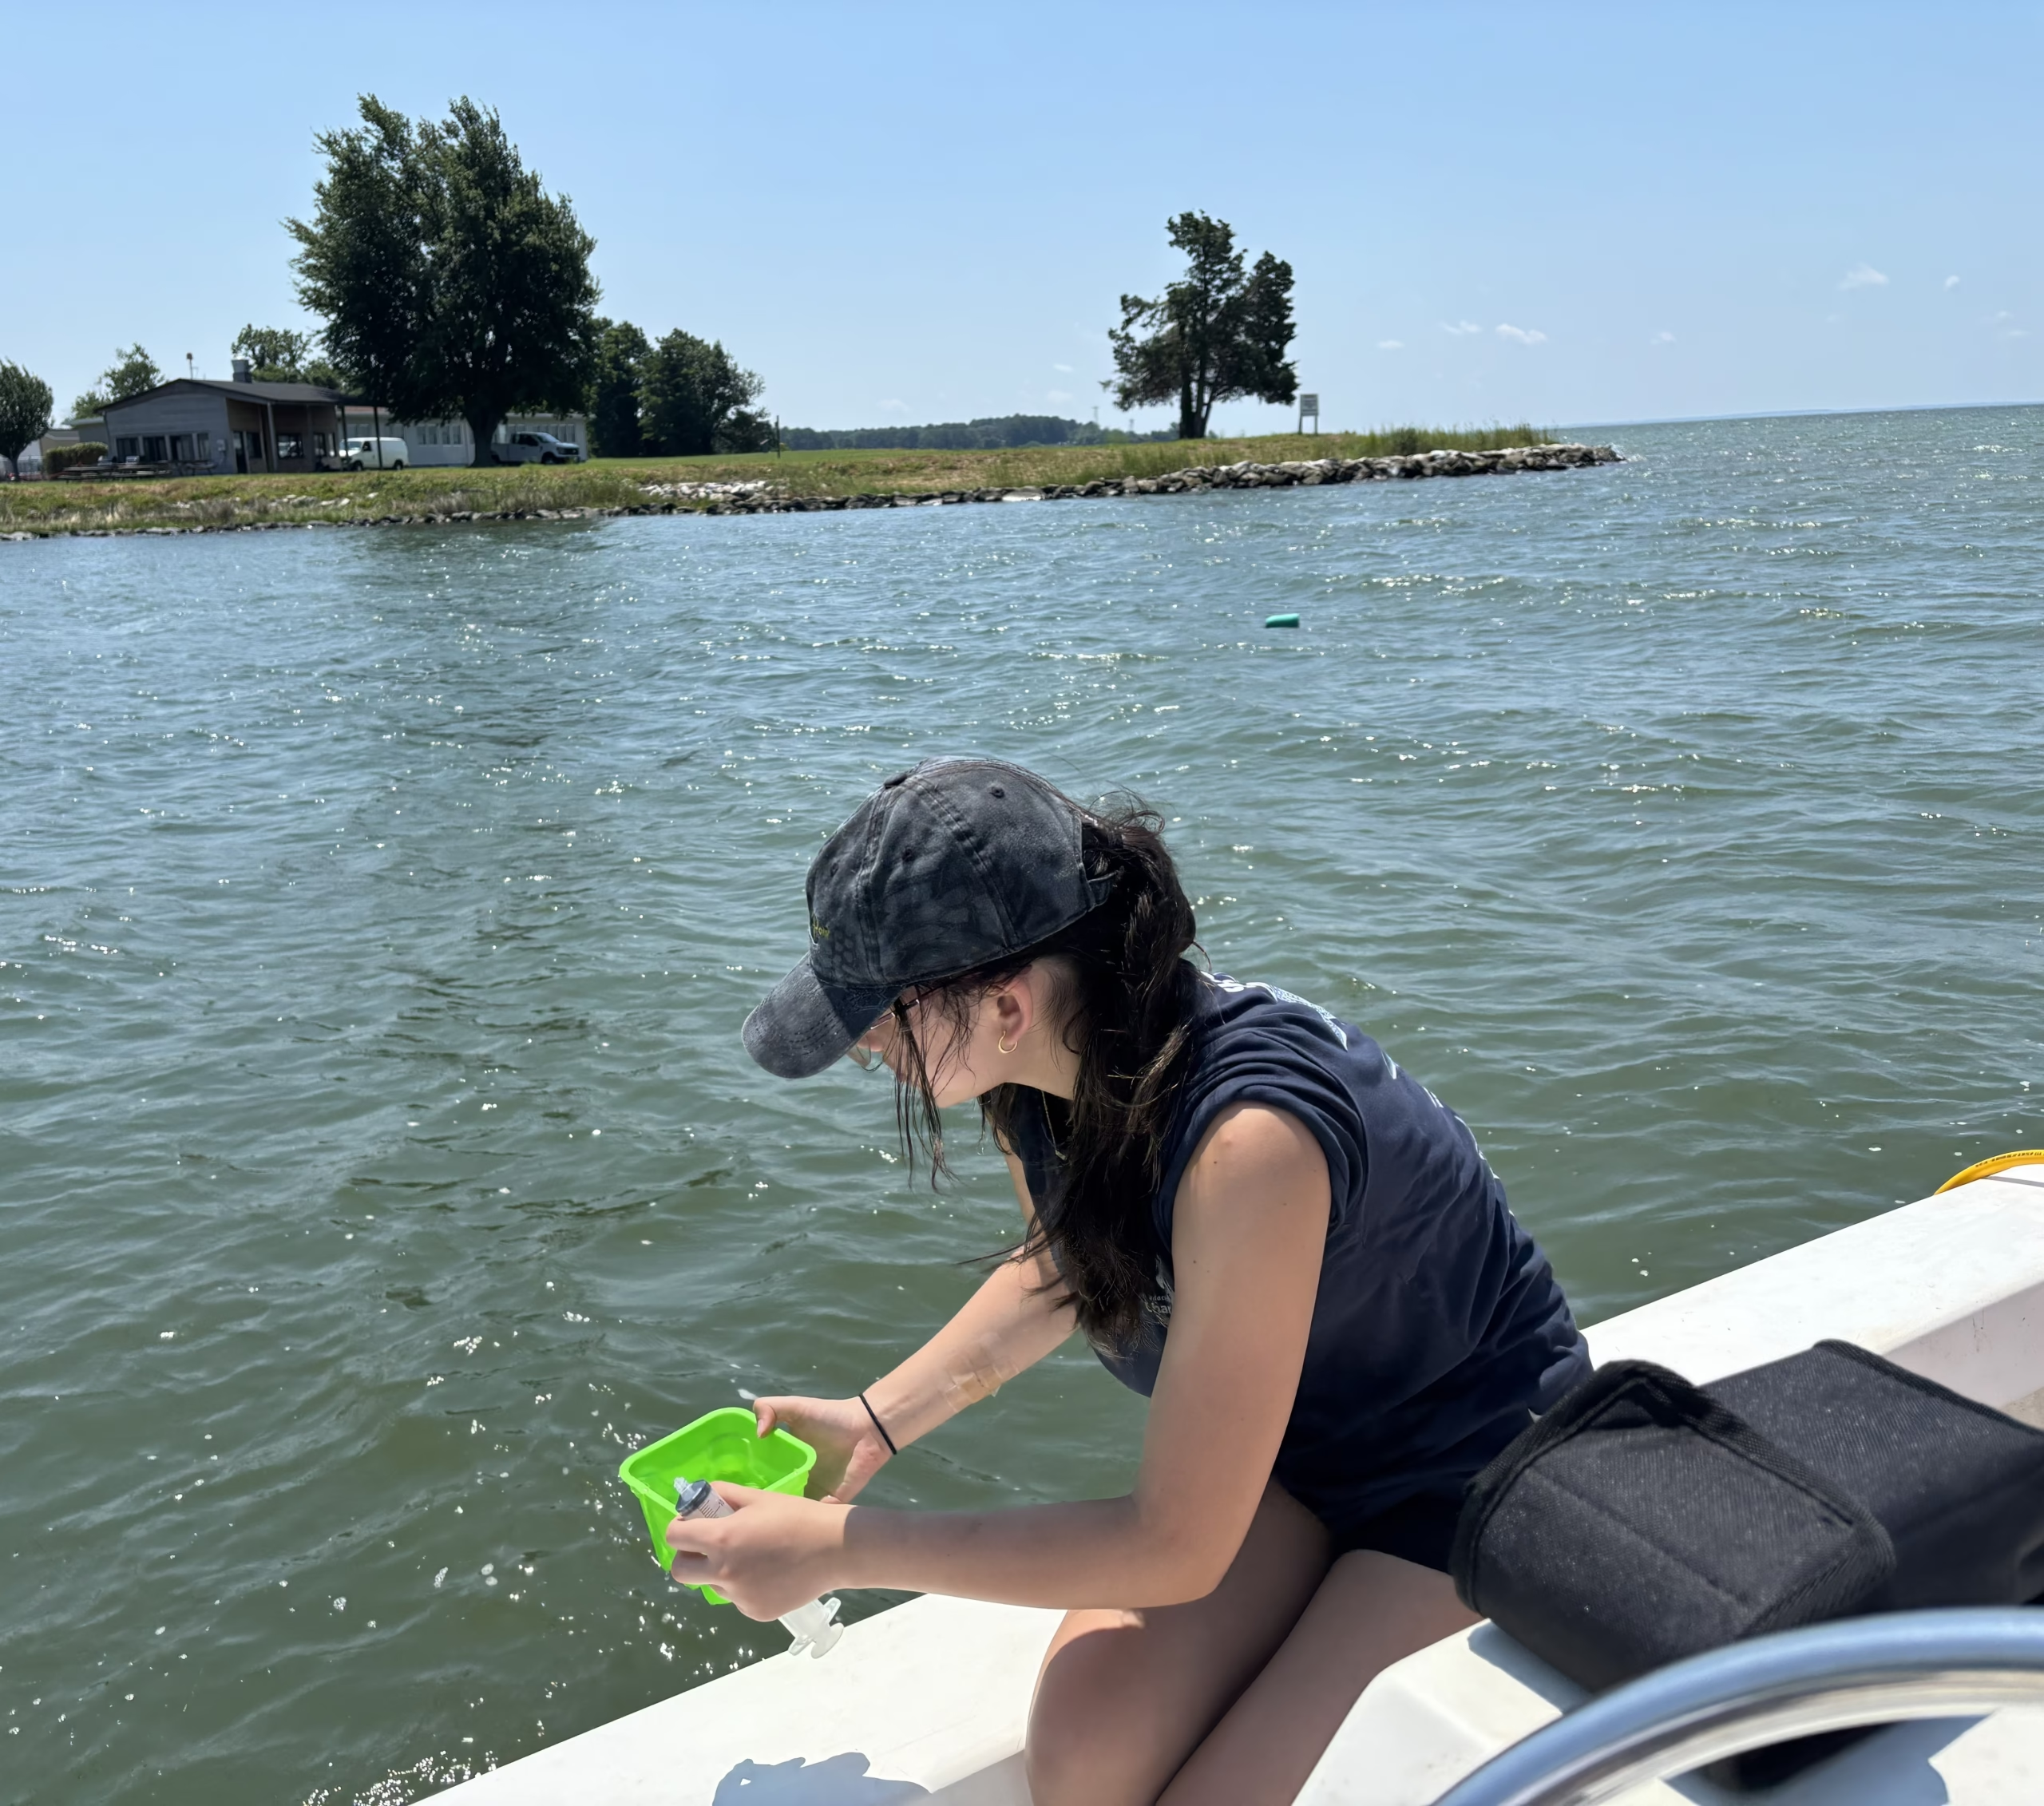
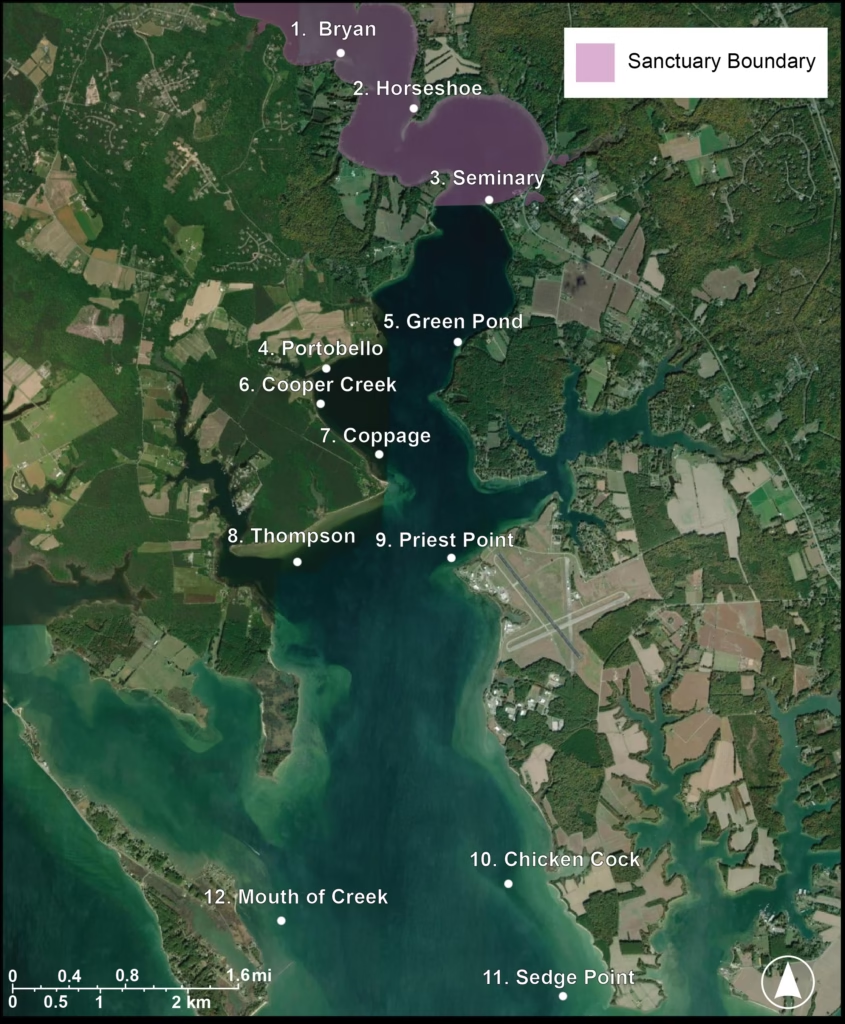
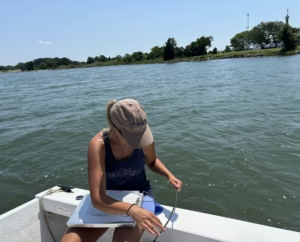
Since 2018, we have monitored water quality at 12 sites throughout the St. Mary’s River as part of our annual oyster reproduction study. We track temperature, dissolved oxygen, salinity, and this year, we’ve added chlorophyll. As we continuously gather water quality data, we’re able to compare the latest measurements against long-term trends. We’d like to share our findings, comparing early summer (June-July) of this year to previous years.
Bottom Water Dissolved Oxygen (DO):
Aquatic ecosystems rely heavily on dissolved oxygen (DO). Just like land animals, fish and invertebrates need oxygen to survive. Oysters are particularly threatened by low oxygen levels because they’re unable to swim to more favorable conditions. Several factors drive DO levels, including seasonal changes, water clarity (turbidity), and excess nutrients. During algae blooms, for example, which are caused by excess nutrients like nitrogen and phosphorus, decomposing bacteria consume vast amounts of available oxygen. By consistently monitoring DO, we can track how oxygen levels fluctuate.
This Year’s DO: Comparing this year to last year, the average DO in June was 0.92 mg/L lower than 2025; in July, the average DO was 2.5 mg/L higher than 2025.
Bottom Water Temperature:
Temperature affects the rate at which oysters grow, filter, and reproduce. Oysters will begin spawning when water temperatures are 20 °C (68 °F).
Our data comparison: Comparing this year’s average bottom water temperature to last year, June was 1.57°C warmer and July was 2.42 °C cooler. Compared to the past five years, the average bottom water temperature for early summer (June-July) was 0.5 ° warmer in 2026.
Bottom Water Salinity:
Salinity is the amount of salt dissolved in the water. The Chesapeake Bay and St. Mary’s River have brackish water, meaning a mix of salt and fresh water. Salinity is affected by freshwater input from rivers, Potomac River tides bringing in saltwater, and seasonal rainfall patterns.
Our data comparison: This year, the average bottom water salinity was 1.87 ppt higher in June and 3.9 ppt higher in July compared to 2025. Compared to the five-year average for early summer (June-July), bottom water salinity was 3.1 ppt higher in 2026.
Other observations:
Bottom water salinity across all 12 sites was higher this year compared to the previous five years. This elevation could be attributed to a reduction in freshwater input following an abnormally dry winter (December 2025 – February 2026).
Water temperatures were consistent with baseline temperatures recorded between 2020 and 2024. The sharp temperature variance between this year and last is likely due to the above-average temperatures observed in 2025, some exceeding normal levels by more than 3 °C. These thermal shifts could have impacted dissolved oxygen (DO) levels, as cooler water holds more oxygen than warmer water.
Sources: